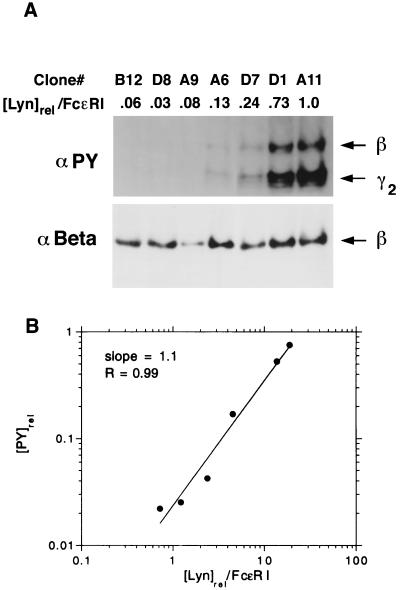
Figure 2.
Relative phosphorylation of FcɛRI after stimulation, as a function of expressed Lyn. This figure is illustrative of the analyses that form the basis of this study. Each clone was reacted with 0.5 μg/ml dimeric IgE for 15 min before solubilization of the cells, reaction of the centrifuged lysate with anti-IgE, and analysis of the immunoprecipitates on gels. (A) Line 2 reports the relative amount of Lyn per FcɛRI for each of the seven clones. (Upper) Western blot with anti-PY. (Lower) Western blot with anti-β after stripping of the gel shown in Upper. For reasons that have not been investigated, the immunoprecipitates from clone A9 regularly showed an abnormally low yield of β chains relative to recovery of radiolabeled IgE, suggesting that the receptors were unusually unstable. (B) log–log plot of the phosphorylation of the β chain ([PY]rel) vs. the relative expression of Lyn per receptor ([Lyn]rel/FcɛRI), for the experiment shown in A. The line that gives the best fit to the data is shown. Its slope is 1.1. The correlation coefficient is 0.99. The data from clone A9 were not included because the small yield of β chains (see above) precluded accurate quantification. In 26 similar plots, reflecting measurements of tyrosine phosphorylation on the β and γ chains at distinct doses of ligand and distinct times, the mean slope is 0.96 ± 0.05.

