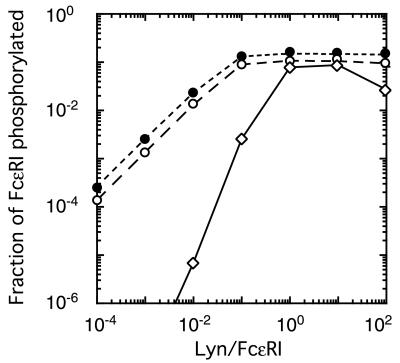
Figure 3.
Results of simulations of the experiments, based on alternative models. Markers indicate the fraction of receptors phosphorylated, as predicted by models A (○, Fig. 1A), B (⋄, Fig. 1B), and an analogue of model A in which receptors are aggregated by trimers of IgE (●), for the experiments in which cells were exposed to 0.3 μg/ml dimeric IgE for 15 min. For each of the three curves, we determined the line that gave the best fit to predicted values of the fraction of FcɛRI phosphorylated, for Lyn/FcɛRI in the range 10−5 to 10−2 (some of the values used lie outside the range shown in this plot). The line giving the best fit to the simulated data, in this linear range, has a slope of 1.0 for model A, in which one Lyn can initiate phosphorylation, and 2.1 for model B, in which two juxtaposed Lyn molecules are required. In the model where aggregation is induced by trimers of IgE but only one Lyn is needed for phosphorylation of receptor tyrosines, the predicted slope is 1.0. Predictions of the slopes are robust. Large changes in the rates of phosphorylation and dephosphorylation, the rates of association and dissociation of the receptor with Lyn, and the times at which phosphorylation is measured result in almost no change in the predicted slopes. Even when we chose the rate of dephosphorylation to be slow compared with the rate of dissociation of Lyn, so that by 15 min a significant fraction of the receptor aggregates that are phosphorylated are not associated with Lyn, the slopes for the two models remain essentially equal to 1 and 2.

