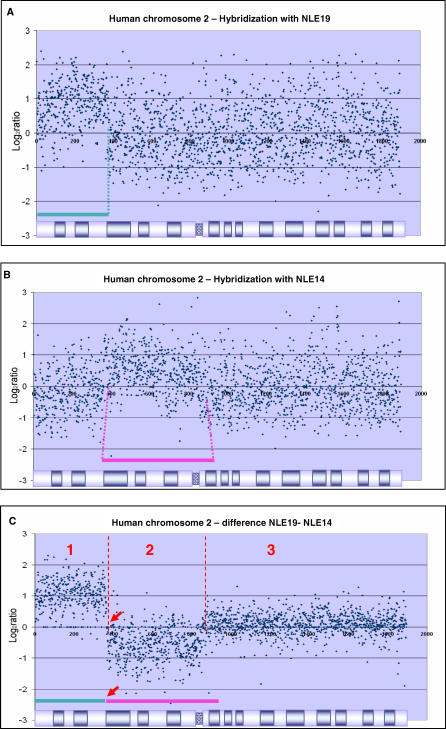
Figure 1. Identification of Break of Synteny Regions Using the Log2 Ratio Difference Method.
(A and B) The plotted value of Log2 ratio/chromosome length for human Chromosome 2 after hybridization with sorted gibbon chromosomes NLE14 and NLE19, respectively.
(C) Results of the application of the difference method to the datasets in (A) and (B). After canceling out the systematic variation, it is possible to discern three different regions from left to right, one amplified (1), one deleted (2), and one at the baseline (3).

