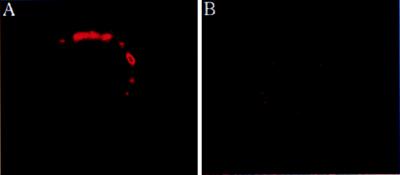
Figure 3.
CTLA-4 surface expression on activated T cells from CHS patient 1 and control T cells. T cells from control (A) and CHS patient 1 (B) were activated by incubation on glass coverslips coated with anti-CD3 and anti-CD28 mAb for 48 h. They were stained for CTLA-4 and then fixed to detect the surface expression of CTLA-4. Confocal analysis showed that CTLA-4 molecules were polarized at the cell surface in the control, whereas they were undetectable in cells from CHS patient 1. After activation, more than 90% of patient and control cells were CD69+.

