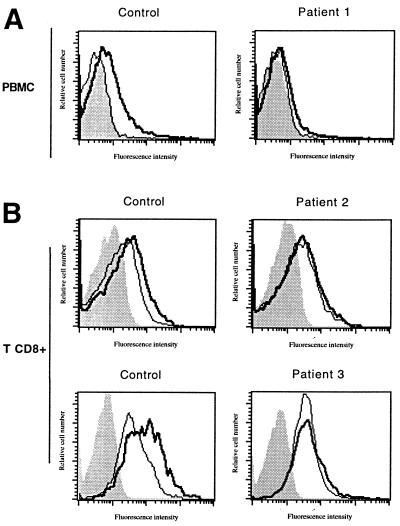
Figure 4.
CTLA-4 surface expression on CHS and control cells after allogeneic activation. (A) PBMCs isolated from patient 1 with lymphoproliferative syndrome and control PBMCs were stained for CTLA-4 (thick lines) after 72 h of allogeneic cell stimulation and pervanadate treatment. More than 90% of the cells from patient 1 and the control were CD69+. (B) PBMCs isolated from patients 2 and 3 and control PBMCs were co-stained for CD8 and CTLA-4 (thick lines). In both patients and control, more than 75% of the CD8+ T cells expressed CD69 and HLA-DR after activation. Control staining was carried out with an isotype-matched irrelevant mAb (thin lines). Shaded areas represent unstained cells.

