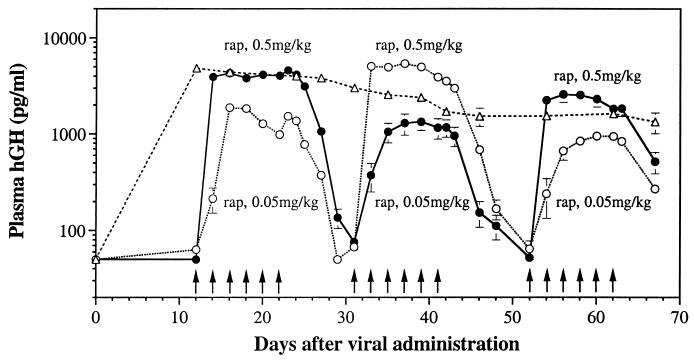
Figure 3.
Control over the level and duration of hGH expression with rapamycin. Male BALB/c nude mice were injected i.m. with 1 × 10¹¹ total particles of Ad.TF1 and Ad.ZG1 in a 1:1 ratio (filled and open circles) or with 5 × 10¹⁰ particles of Ad.CMVhGH (open triangles). Mice receiving Ad.TF1 and Ad.ZG1 were divided into two groups. Group 1 (open circles) received six consecutive doses of rapamycin (0.05 mg/kg, i.p.) every 2 days. Plasma samples were taken before each rapamycin dose and every other day after the last dose of rapamycin. The second and third sets of rapamycin challenges (0.5 and 0.05 mg/kg, respectively) were initiated when plasma hGH returned to basal levels from the previous challenges. Group 2 (filled circles) received similar injection and bleeding schedules but a 10-fold higher dose of rapamycin initially (0.5 mg/kg), with subsequent dosing schedules of 0.05 and 0.5 mg/kg. Values of plasma hGH are mean ± SEM of 5 mice for the group receiving Ad-CMVhGH and 10 mice for groups receiving Ad.TF1 and Ad.ZG1. Arrows indicate times of rapamycin dosing. The lower limit of detection of the hGH assay is 50 pg/ml.

