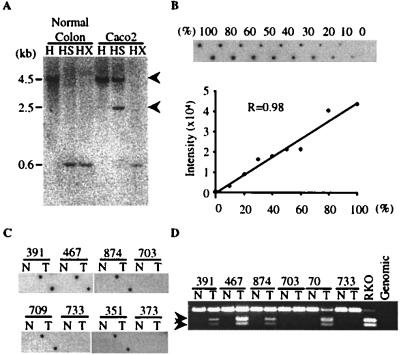
Figure 1.
Comparison of detection of aberrant methylation by using Southern blotting, MCA, or bisulfite-PCR analysis. (A) Methylation of MINT2 detected by Southern blot analysis. Genomic DNA from normal colon mucosa of an 18-year-old person and the CRC cell line Caco2 was digested with restriction endonucleases (H, HindIII; HS, HindIII + SmaI; HX, HindIII + XmaI), electrophoresed, blotted, and hybridized with MINT2 probe. Caco2 DNA fails to digest completely with SmaI, indicating methylation of one or both SmaI sites, but cuts down with XmaI, ruling out polymorphisms at the SmaI sites. (B) Semiquantitative feature of MCA. DNAs from the Caco2 cell line and normal colon were mixed in various proportions before MCA, and methylation of MINT2 was analyzed by dot-blot hybridization (Upper). % refers to the relative proportion of Caco2 DNA. The signal intensity of each dot was determined by PhosphorImager densitometry, and it increased linearly relative to the proportion of tumor cells in the mix. (C) Detection of MINT2 methylation by MCA. We blotted 0.1 μg of MCA products from colorectal tumors and corresponding normal colon mucosa in duplicate onto a nylon filter and hybridized them with a MINT2 probe. Tumors 391, 467, 874, 709, and 351 are methylated at this site. Sample numbers are shown above each lane. N, normal colon; T, colon tumor. (D) Detection of methylation by bisulfite-PCR. Genomic DNA was treated with bisulfite and amplified with primers specific to MINT2. Twenty percent of the PCR products were digested with BstUI and electrophoresed in 3% agarose gels. Arrows indicate bands reflecting methylation of the BstUI site. BstUI cleaves only the methylated alleles, yielding 115- and 88-bp bands (seen in a CRC cell line, RKO, and tumors 391, 467, 874, and 709). The coexistence of methylated and unmethylated bands reflects the fact that all these tumors are not microdissected and contain various amounts of contaminating normal tissues. Sample numbers are shown above. N, normal colon; T, colon tumor.

