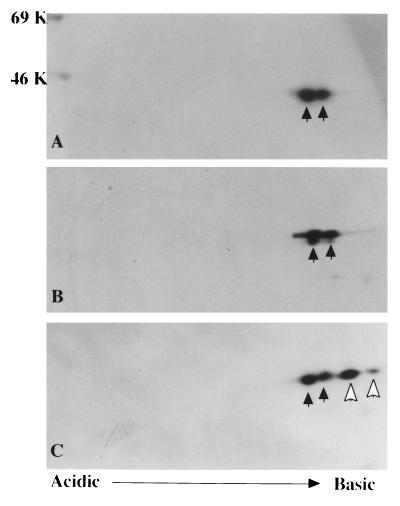
Figure 3.
In vitro translation products of actin cDNAs cloned from patient’s cells and normal control cells. Products of control β-actin (A), γ-actin (B), and the mutant β-actin cDNAs together with control β-actin molecules (C) were subjected to 2D PAGE. Closed and open arrows indicate products of normal and mutant actin cDNA, respectively. Each set of spots includes both nonacetylated (right) and acetylated actin (left). Molecular weight markers are indicated on the left.

