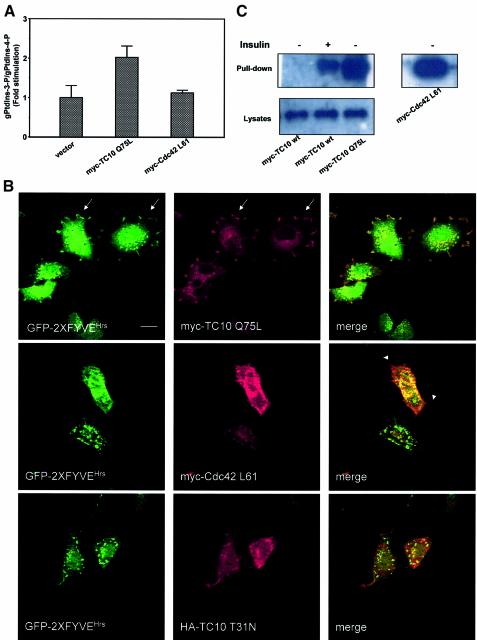
Fig. 5. The insulin-mediated formation of PtdIns-3-P occurs through the activation of TC10. (A) L6 cells were transfected with myc-TC10 Q75L, myc-Cdc42 L61 or the empty vector. After 24 h, cells were labelled with myo-[3H]inositol and HPLC analysis of PtdIns-3-P levels was performed as described in Materials and methods. Data are mean ± SEM of two independent experiments performed in duplicate. (B) L6 cells were co-transfected with GFP–2XFYVEHrs and either myc-TC10 Q75L, myc-Cdc42 L61 or HA-TC10 T31N. After 24 h, cells were serum starved for 6 h and analysed by confocal microscopy. HA-TC10 T31N-co-transfected cells were stimulated with 300 nM insulin for 3 min before confocal analysis. Arrows indicate the plasma membrane localization. Arrowheads mark the filopodia induced by overexpression of myc-Cdc42 L61. Bar, 10 µm. (C) L6 cells were transfected with myc-TC10 wt, myc-TC10 Q75L or myc-Cdc42 L61. Serum-deprived cells were left untreated or stimulated with insulin for 3 min. Lysates were incubated with GST-Pak1 PBD and pull-down assay was performed as described in Materials and methods. Association of the overexpressed proteins with the GST-Pak1 PBD was assessed in western blot analyses by using an anti-myc antibody (upper panels). Equal amount of the overexpressed proteins in lysates was confirmed by loading an aliquot of each lysate (bottom panel). Blot is representative of three independent experiments.

An official website of the United States government
Here's how you know
Official websites use .gov
A
.gov website belongs to an official
government organization in the United States.
Secure .gov websites use HTTPS
A lock (
) or https:// means you've safely
connected to the .gov website. Share sensitive
information only on official, secure websites.
