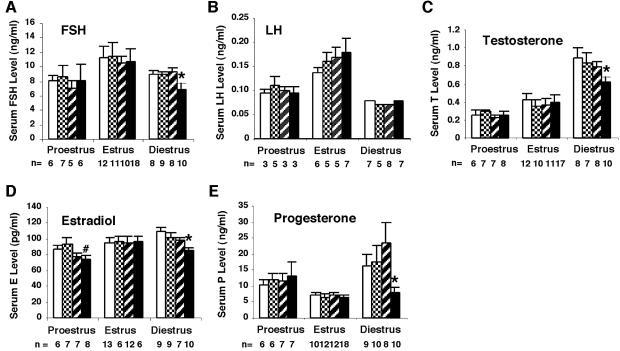
Fig. 3. Serum levels of gonadotropins and steroid hormones in the GCNFfl/flZp3Cre+ females during the estrous cycle. (A) FSH, (B) LH, (C) testosterone, (D) estradiol and (E) progesterone levels in the GCNFfl/flZp3Cre+ (filled bar), and three control groups, GCNF+/+ (open bar), GCNFfl/fl (grid bar) and GCNFfl/+Zp3Cre+ (striped bar), are presented as means ± SEs among the indicated numbers of samples in each group in the bar graph. *P < 0.05, when compared with three control groups at diestrus. #P < 0.05, when compared with GCNF+/+ or GCNFfl/fl at estrus.

An official website of the United States government
Here's how you know
Official websites use .gov
A
.gov website belongs to an official
government organization in the United States.
Secure .gov websites use HTTPS
A lock (
) or https:// means you've safely
connected to the .gov website. Share sensitive
information only on official, secure websites.
