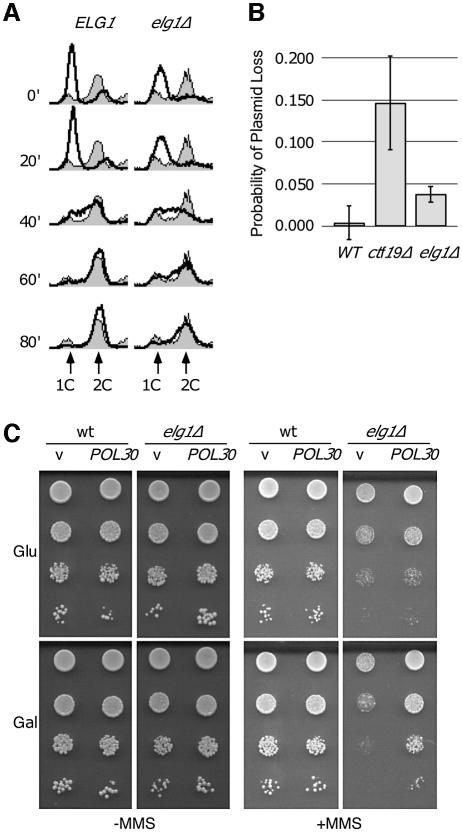
Fig. 6. elg1Δ mutants display DNA replication defects. (A) Progression through S phase. Wild-type or elg1Δ cells were arrested in G1 (t = 0) and released synchronously into the cell cycle. Samples were removed at the indicated times and analyzed by flow cytometry. The shaded histograms represent the cell cycle distribution of the asynchronous cultures before the G1 arrest. Overlaid histograms represent the cell cycle distribution at the indicated times after release from the G1 arrest. The positions of cells with 1C and 2C DNA contents are indicated. (B) Plasmid loss in wild-type, elg1Δ and ctf19Δ. The probability of plasmid loss per generation is plotted, and error bars span 1 SD. (C) Suppression of elg1Δ MMS sensitivity by PCNA overexpression. Serial dilutions of wild-type or elg1Δ cells carrying empty vector (v) or GAL1-POL30 plasmid (POL30) were plated on synthetic medium with 2% glucose (Glu; uninduced) or 2% galactose + 2% raffinose (Gal; induced), plus or minus 0.01% MMS.

An official website of the United States government
Here's how you know
Official websites use .gov
A
.gov website belongs to an official
government organization in the United States.
Secure .gov websites use HTTPS
A lock (
) or https:// means you've safely
connected to the .gov website. Share sensitive
information only on official, secure websites.
