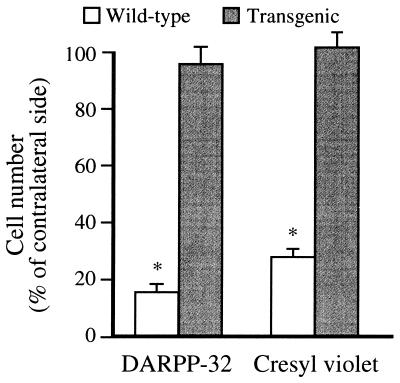
Figure 4.
Quantification of the number of striatal DARPP-32- and cresyl violet- labeled cells 14 days after intrastriatal quinolinic acid injection. The number of positive cells was counted in the five coronal sections closest to the site of injection and is expressed as a mean (error bar = SD) percentage of the number of positive cells on the contralateral unlesioned side (n = 9 transgenic mice; n = 7 wild-type mice). ∗, P < 0.0001.

