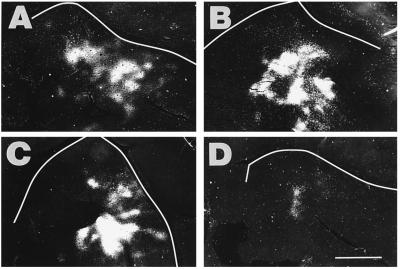
Figure 3.
Pattern of callosal connections in the left AI from cross-modal animals with large rerouting lesions. The panels are arranged from the smallest (IA) to the largest (D) lesion in this large lesion size class. Note that the orientation of the left AI in the micrographs of cross-modal ferret cortices (Figs. 3 and 4) has been photographically reversed from left to right to facilitate comparisons with deaf and normal animals. Tracer was injected throughout the right AI, and it revealed an absence of bands and a concentration of the label in the ventral part of the left AI. The extent of labeling was markedly reduced compared with normal animals, especially in D. (Scale bar = 2.5 mm.)

