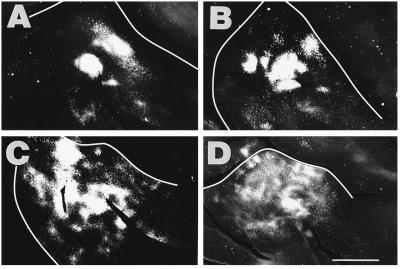
Figure 4.
Pattern of callosal connections in the left AI from cross-modal animals with smaller rerouting lesions. The panels are arranged from largest (A) to smallest (D) lesion in this medium-sized lesion class, in the opposite order from Fig. 3. Tracer was injected in the right AI. A and B are from animals with larger lesions than C and D. The alterations in the callosal patterns were less severe with smaller lesions. (Scale bar = 2.5 mm.)

