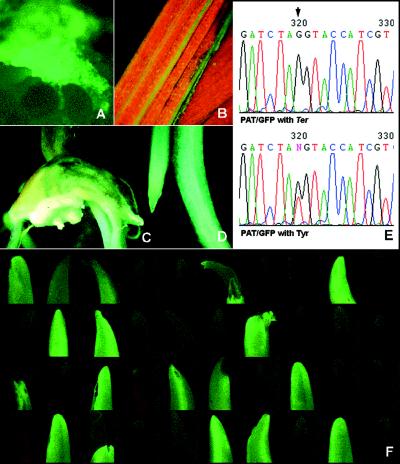
Figure 4.
GFP expression in T0 callus (A), leaves (B), germinating embryo (C), and roots (D) after PAT/GFP conversion. (E) Chromatogram of the junction region of the targeted PAT/GFP showing sequence obtained directly from PCR amplification. (F) T1 progeny segregation. In seedlings with GFP expression, strong green fluorescence was detected in the coleoptiles that lack chlorophyll. In contrast, coleoptiles in seedlings without GFP expression were semitransparent under the excitation and emission spectra used, and leaf chlorophyll autofluorescence could be seen through coleoptile tissue.

