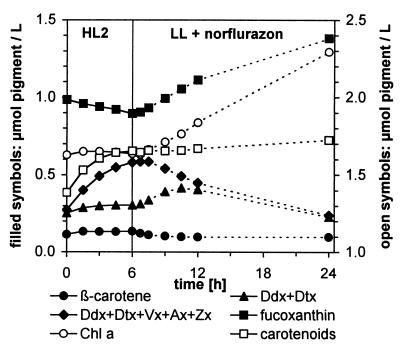
Figure 7.
Time course of pigment changes in a cell suspension of P. tricornutum during 6-h illumination with HL2 (solid lines) and transformations of carotenoids in subsequent LL after addition of norflurazon (5 μM; dashed lines). Note that instead of the Vx cycle pool alone, the sum of both pools is depicted; the quantity of (Vx + Ax + Zx) then is represented by the area between (Ddx + Dtx) and the bulk of both pools.

