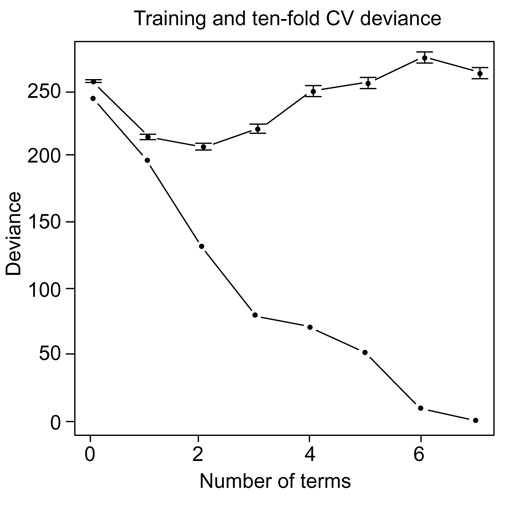
Figure 7.

Model deviance for the tumor data. The lower curve is on the training data, and reaches 0 after seven terms (a saturated fit). The 0th term is the constant fit. The upper curve is based on ten-fold cross-validation, where care was taken to balance the class distribution in each fold.
