
Figure 8.
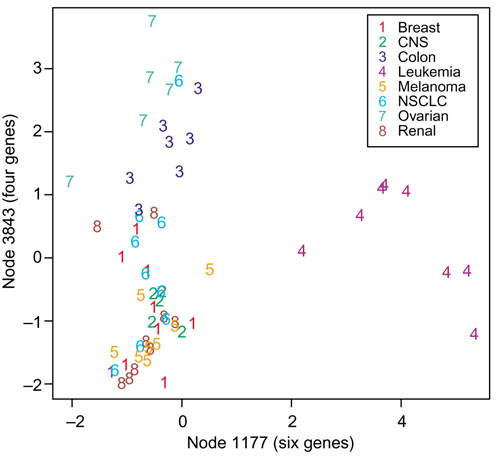
Plot of average expression for each of the first two clusters, with samples identified by cancer class. Some clear separation is apparent.
Official websites use .gov
A
.gov website belongs to an official
government organization in the United States.
Secure .gov websites use HTTPS
A lock (
) or https:// means you've safely
connected to the .gov website. Share sensitive
information only on official, secure websites.
Plot of average expression for each of the first two clusters, with samples identified by cancer class. Some clear separation is apparent.