Figure 2.
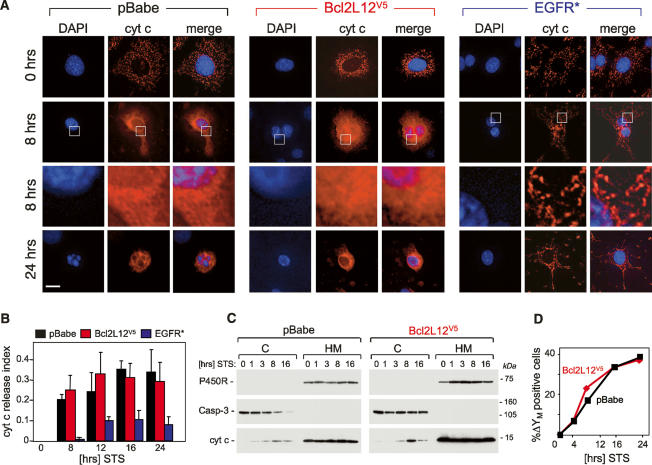
Impact of Bcl2L12 overexpression on mitochondrial integrity following exposure to an apoptotic stimulus. (A) pBabe-, Bcl2L12-, and EGFR*-expressing Ink4a/Arf-deficient astrocytes were treated with 100 nM STS for the indicated periods of time, subjected to immunofluorescence using a monoclonal anti-cytochrome c antibody, and analyzed by deconvolution immunofluorescence microscopy. DAPI, cytochrome c immunofluorescences, and merge images are shown. The framed areas in row 2 were enlarged (row 3) to further document diffuse cytochrome c staining in pBabe and Bcl2L12V5 astrocytes and preserved mitochondrial cytochrome c localization in EGFR* cultures. (B) Cytochrome c release was quantified by counting cells with diffuse cytosolic cytochrome c staining and presented as a fraction of the total number of cells counted (index). Three HPFs were counted; error bars represent standard deviations, and two-tailed p values were calculated using the Student’s t-test (p < 0.05 for pBabe vs. EGFR* at all time points of STS stimulation). (C) Ink4a/Arf−/− astrocytes ectopically expressing pBabe or Bcl2L12V5 were treated with STS (1 μM) for the indicated periods of time. Cytosolic (C) and membranous (M) compartments were isolated and subjected to Western blot analysis to determine cytochrome c distribution. Caspase-3 and cytochrome P450 reductase are shown as marker proteins assessing equal loading and fraction purity. (D) Bcl2L12 does not protect inner mitochondrial membrane integrity. Bcl2L12V5- and pBabe-expressing Ink4a/Arf−/− astrocytes were treated with STS (1 μM) for the indicated periods of time, and the mitochondrial transmembrane potential (ΔΨM) was determined by JC-1 staining and quantified by FACS analysis. The experiment was performed in duplicate, and standard deviations were too small to be depicted.

