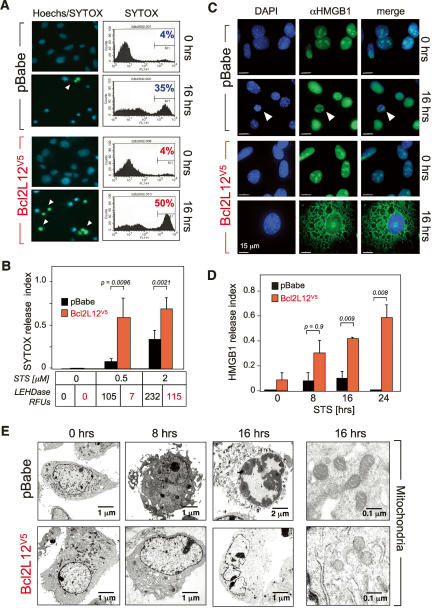
Figure 4.
Bcl2L12 promotes necrosis. (A) pBabe- or Bcl2L12-expressing Ink4a/Arf−/− astrocyte cultures were treated with STS (2 μM) for 20 h prior to staining with a combination of Hoechst 33342 and SYTOX Green, a green fluorescent dye staining necrotic cells with a disintegrated plasma membrane. The percentage of the necrotic population was determined by FACS. (B) pBabe- or Bcl2L12-expressing Ink4a/Arf-deficient astrocytes were treated with the indicated amounts of STS, and SYTOX-Green positivity as well as relative LEHDase activity (indicated as relative fluorescence units, RFUs) was assessed. Approximately 100 cells per HPF (total of three HPFs) were counted for each data point and the necrotic index was calculated as the fraction of cells positive for SYTOX green divided by the total number of cells counted. Error bars represent standard deviations of replicate data points, and two-tailed p values were calculated using the Student’s t-test. (C) pBabe- or Bcl2L12-expressing Ink4a/Arf−/− astrocyte cultures were incubated for the indicated periods of time with 1 μM STS, and subjected to anti-HMGB1 staining using a polyclonal anti-HMGB1 antibody. Representative pictures of DAPI, anti-HMGB1, and merged immunofluorescences are shown. White arrowheads point to a secondary necrotic cell. Of note, all HMGB1 immunfluoresence images were taken at the same magnification. The apparent large size of STS-treated Bcl2L12 astrocytes reflects the fact that these cells are necrotic with swollen nuclei and extended cytoplasms. Bar, 15 μm. (D) Quantitation of HMBG1 cytosolic staining of cultures from C over a 24-h period by counting numbers of HMBG1-positive cells per HPF (total of three HPFs counted per time point). Cells with released HMGB1 were divided by the total number of cells counted and expressed as an HMBG1 release index. Error bars represent standard deviations of replicate data points, and two-tailed p values were calculated using the Student’s t-test. (E) pBabe- or Bcl2L12V5-expressing Ink4a/Arf-deficient astrocytes were incubated with STS (1 μM) for the indicated periods of time, and cellular morphology (left) as well as mitochondrial ultrastructure (right) were analyzed by transmission electron microscopy.

