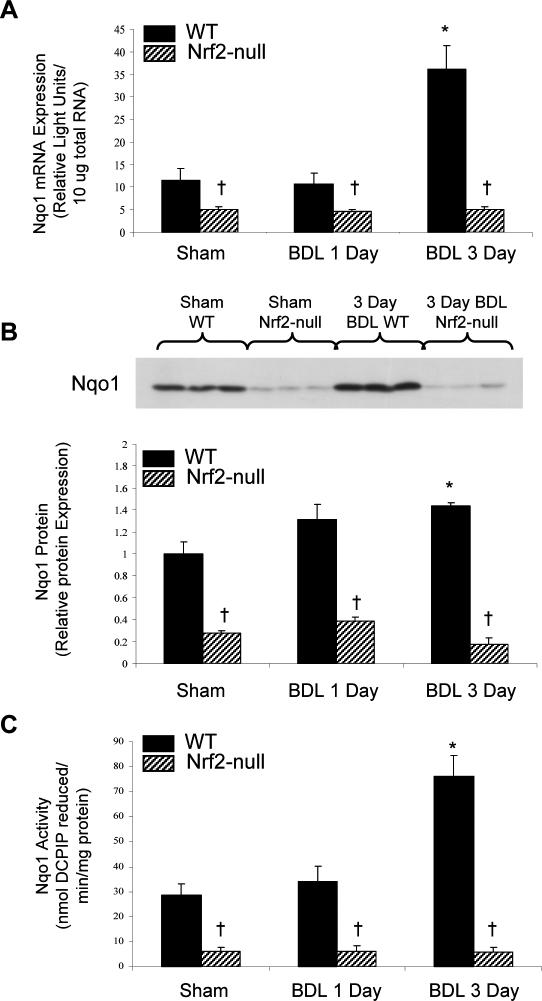
Fig 3.
Expression and activity of Nqo1 in liver cytosolic fractions from wild-type and Nrf2-null mice 1 and 3 days after sham or BDL surgery. (A) Total RNA was isolated from livers of WT and Nrf2-null mice that underwent sham or BDL surgery 1 or 3 days previously, and analyzed by the bDNA assay for Nqo1 mRNA expression. Data from sham animals at 1 and 3 days were not statistically different and were pooled and denoted as sham. The data are presented as mean relative light units ± standard error of the mean (SEM) (n = 4–7 animals). (B) Upper panel: Representative Western blot of liver cytosolic fractions from mice 3 days after sham or BDL surgery (n = 4–7 animals) stained with anti-Nqo1 antibodies. Lower panel: Quantification of Nqo1 protein levels in liver cytosolic fractions from mice 1 and 3 days after sham or BDL surgery. The data are presented as relative protein expression ± SEM (n = 4–7 animals). (C) Analysis of Nqo1 activity in liver cytosolic fractions from WT and Nrf2-null mice that underwent sham or BDL surgery 1 or 3 days previously. The data are presented as nanomoles of DCPIP reduced per minute per milligram of protein ± SEM (n = 4–7 animals). Asterisks (*) represent a statistical difference (P < 0.05) between WT sham and WT BDL groups, and crosses (†) represent a statistical difference between WT and Nrf2-null mice undergoing the same type of surgery

