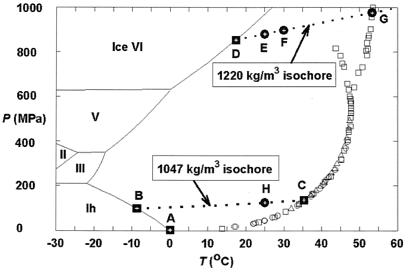
Figure 1.
Previous experimental results and the pressure–temperature (P–T) conditions for in situ observations in this study for the system CH4–H2O. The experimental data for the univariant P–T relations of the assemblage methane hydrate–water–methane vapor were taken from Marshall et al. (circles; ref. 10), Dyadin et al. (squares; ref. 11, ‖), and Nakano et al. (triangles; ref. 12). All symbols are for sI methane hydrate, except those squares branching out at higher P–T conditions. The boundaries for the stable ice phases and their melting curves (solid lines) are from ref. 13. Points A, B, C, and D (solid squares) indicate the P–T conditions for four invariant points, and they are for the following assemblages, respectively: sI methane hydrate–liquid water (Lw)–ice Ih–methane vapor (V), sI and sII methane hydrates–Lw–ice Ih, sI and sII methane hydrates–Lw–V, and sI and sH methane hydrates–Lw–ice VI. Points E, F, and G (dots) are P–T points along the isochore of pure water for 1,220 kg/m3 (14), and point H (dot) is a P–T point along the isochore of pure water for 1,047 kg/m3. The former isochore was defined by the melting P–T condition of ice VI at point D (16.6°C and 0.84 MPa; ref. 15), and the latter isochore by the melting P–T condition of ice Ih at point B (−8.7°C and 99 MPa; I-M.C., A.S., R.C.B., R.J.H., A.F.G., L.A.S., and S.H.K., unpublished observations). The latter isochore is also the univariant P–T conditions for the assemblage sI and sII methane hydrates–Lw (I-M.C., A.S., R.C.B., R.J.H., A.F.G., L.A.S., and S.H.K., unpublished observations).

