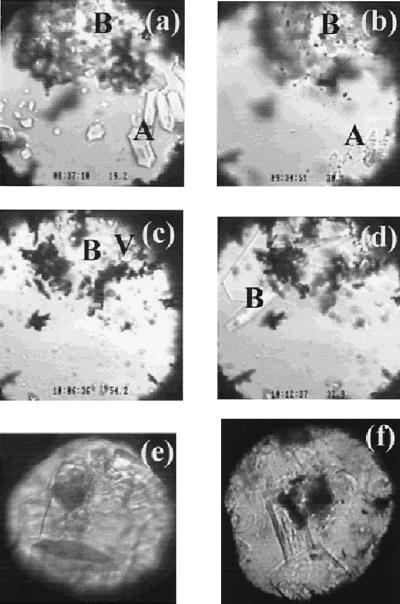
Figure 2.
(a–d) Images of a sample during a cooling, heating, and cooling cycle. (a) The coexistence of sI methane hydrate (A), sH methane hydrate (B), and water at 19.2°C and 880 MPa (near point D in Fig. 1). (b) The trace of sI methane hydrate at about 30°C and 900 MPa (point F in Fig. 1) immediately preceding full dissociation induced by heating. (c) The partial decomposition of the sH methane hydrate at 54°C and 980 MPa (point G in Fig. 1) and the formation of methane vapor (bubbles at the top-right corner indicated by V). (d) The growth of sH methane hydrate crystals during slow cooling at 33°C and 910 MPa (near point F in Fig. 1). (e) Images of single crystals of sH methane hydrate of a different sample at about 600 MPa and 25°C, taken after synchrotron x-ray diffraction analysis. The dark circular area is the spot damaged by the x-ray beam. The hexagonal dark area at lower part of the view is the base (001) face, and the hexagonal prism faces (100) are also clearly shown. (f) Images of single crystals of sII methane hydrate at about 250 MPa and 25°C, taken after synchrotron x-ray diffraction analysis. The dark circular area at the center of the view is the spot damaged by the x-ray beam. The cubic (100) face is clearly shown for the crystal at the lower part of the view. (The field of view in a–d is about 0.3 mm and the sample chamber is about 0.25 mm thick. The field of view in e and f is about 0.2 mm, and the sample is about 0.15 mm thick.)

