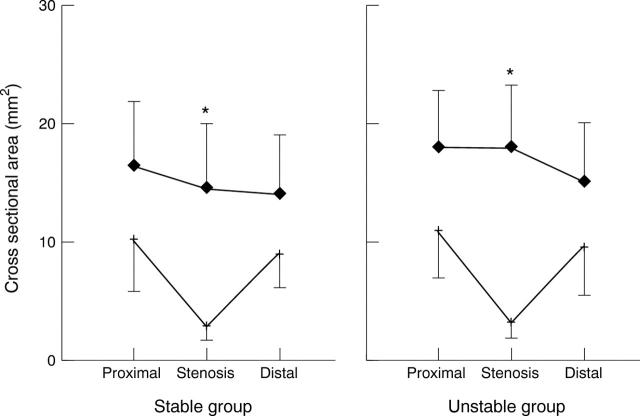
Figure 1 .
Mean cross sectional area values of lumen (+) and vessel (♦) at the proximal reference, stenosis, and distal reference sites in the two groups of patients. Error bars are standard deviations. Only vessel area at the stenosis site (*) was significantly different between the groups: 14.6 (5.4) v 18.1 (5.3) mm2 (p = 0.008).

