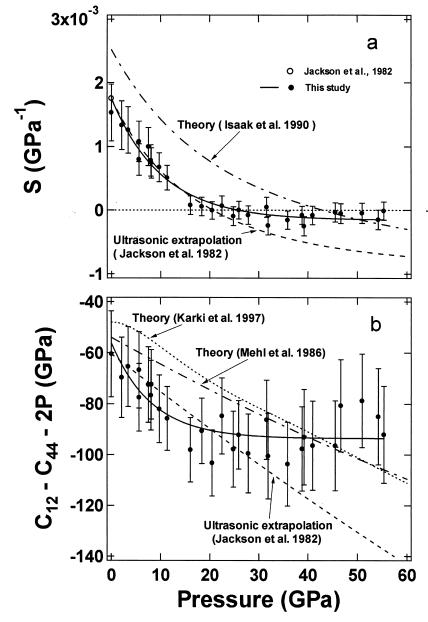
Figure 4.
Pressure dependence of elastic anisotropy (a) and Cauchy condition for MgO (b). The solid circles are measured points from this study, and the solid curves indicate the observed trend. Ultrasonic results measured at ambient pressure and extrapolations to higher pressure are given by open-circle and dashed curves (8). Dot–dashed curves are theoretical PIB results from refs. 10 and 13, and the dotted curve in b is the theoretical result from ref. 37.

