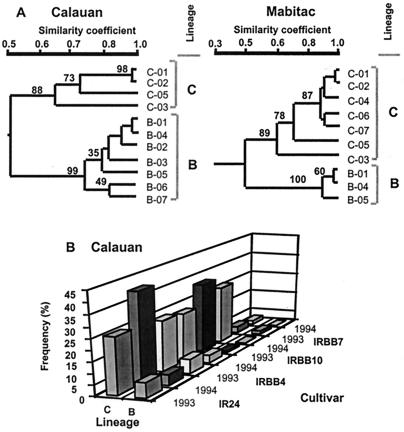
Figure 2.
(A) Genetic structure of Xoo populations in Calauan and Mabitac assessed in 1993 and 1994. Using UPGMA, Xoo lineages B and C were identified from genomic profiles generated by PCR assays. Lineages B and C were separated by cluster analysis at approximately 48% and were robust based on bootstrap analysis (values of 88–100%, ref. 35). Numbers on branches of dendrograms indicate the stability of branch arrangement based on 2,000 iterations of resampling. (B) Frequency of lineages B and C in Calauan on four rice lines in 1993 and 1994. Lineage C dominated the pathogen population in all rice lines.

