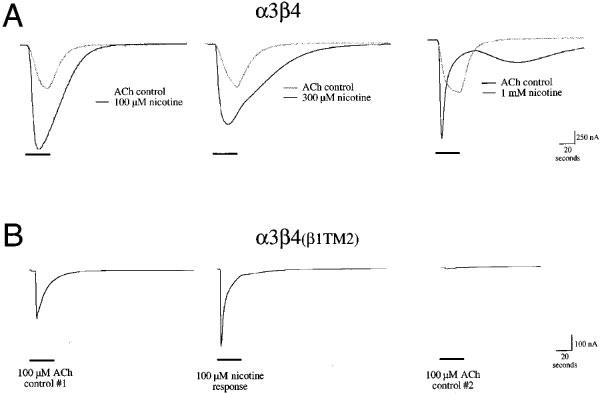
Figure 5.

Representative traces illustrating the effect of nicotine on α3β4 and α3β4(β1TM2) receptors. (A) Sample responses of α3β4 expressing cells to the application of nicotine at the indicated concentration, shown along with respective control ACh responses obtained 5 min earlier from the same cells. Note that at concentrations above 100 μM, nicotine fails to produce further increases in peak currents compared to ACh controls. However, nicotine does produce a protracted or late-phase current that can be associated with secondary inhibitory activity by this compound. Recovery from this inhibition is relatively rapid, as can be seen from the relaxation out of the inhibited state, clearly visible after the application of 1 mM nicotine. (B) The responses of an α3β4(β1TM2) receptor-expressing oocyte to the initial control application of 100 μM ACh (left-most trace), the application of 100 μM nicotine (middle trace), and a subsequent 100 μM ACh control response (right-most trace).
