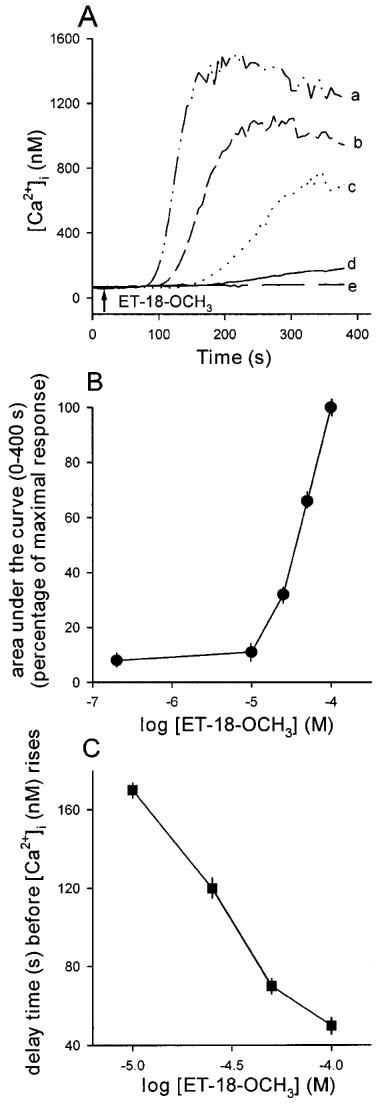
Figure 1.

(A) Concentration-dependent effects of ET-18-OCH3 on [Ca2+]i. Concentration of ET-18-OCH3 was 100 μM in trace a, 50 μM in trace b, 25 μM in trace c, 10 μM in trace d and zero in trace e. ET-18-OCH3 was applied at 30 s. The experiments were performed in Ca2+ medium. Traces are typical of 3–4 experiments. (B) A concentration-response plot of the ET-18-OCH3-induced Ca2+ signals shown in (A). The y axis is the area under the curve (percentage of maximum response). The x axis is the concentration of ET-18-OCH3 in logarithmic scale. The data are means±s.e.mean of 3–4 experiments. (C) Relationship between the delay time (s) before [Ca2+]i (nM) rises. The data are means±s.e.mean of 3–4 experiments.
