Figure 2.

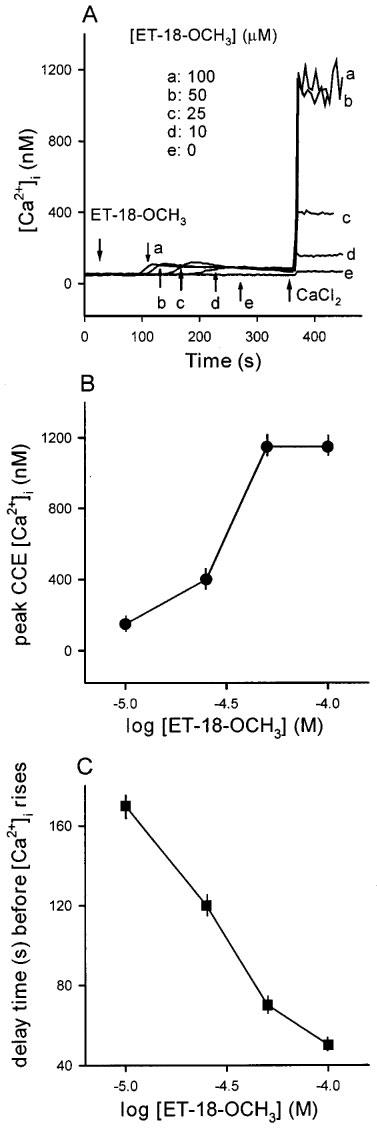
(A) ET-18-OCH3-induced capacitative Ca2+ entry. These experiments were performed in Ca2+-free medium. Capacitative Ca2+ entry was induced by depleting intracellular Ca2+ stores with different concentrations of ET-18-OCH3 (10–100 μM) in Ca2+-free medium (no added Ca2+ plus 1 mM EGTA) followed by addition of 3 mM CaCl2. Trace e is the control CaCl2 effect without ET-18-OCH3 pretreatment. (B) A concentration-response plot of the ET-18-OCH3-induced capacitative Ca2+ entry shown in (A). The y axis is the peak height of the [Ca2+]i rise induced by addition of 3 mM CaCl2. The x axis is the concentration of ET-18-OCH3 in logarithmic scale. The data are means±s.e.mean of 3–4 experiments. (C) Relationship between delay time (s) before [Ca2+]i rises and the concentration of ET-18-OCH3. The data are means±s.e.mean of 3–4 experiments.
