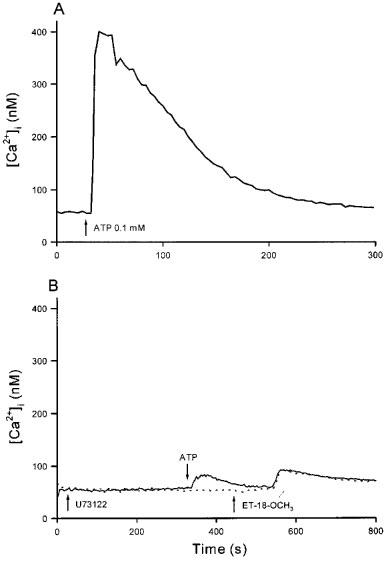
Figure 4.

Effect of inhibition of IP3 production on the ET-18-OCH3-induced internal Ca2+ release. (A) 0.1 mM ATP was added at 30 s. (B) U73122 (2 μM) was added at 30 s followed by ATP (0.1 mM) and ET-18-OCH3 (25 μM) at 340 s and 440 s, respectively. These experiments were performed in Ca2+-free medium. Traces are typical of 3–4 experiments.
