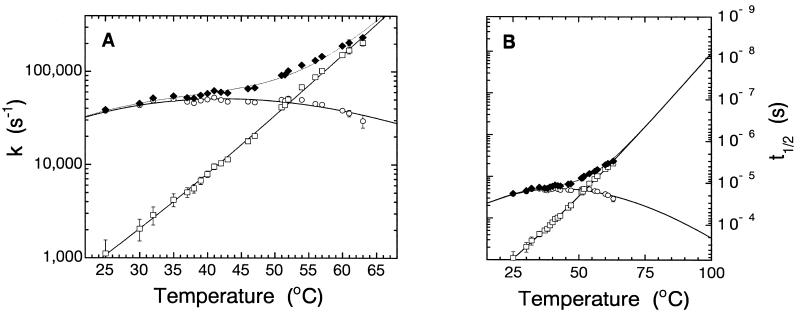
Figure 3.
Folding kinetics at increasing temperatures. (A) Relaxation rate constants (♦) are plotted in a logarithmic axis vs. temperature. Folding (kf, ○) and unfolding (ku, □) rate constants were extracted from kobs as described in the text, plotted in an Eyring plot of ln(kobs/T) vs. 1/T (K−1) (not shown) and fitted individually to ln (k/T) = ln (kB/h) − ΔG‡/RT to estimate the half-times of reaction up to 100°C shown in B.

