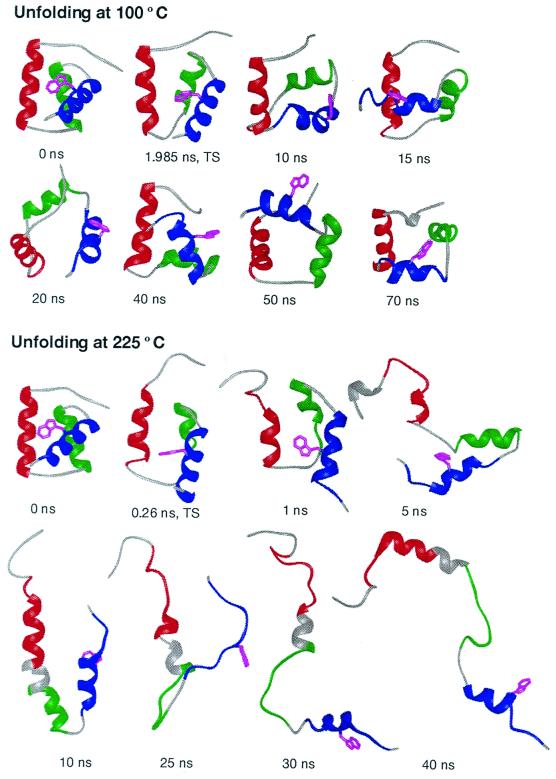
Figure 4.
Time progression of the thermal denaturation of En-HD at neutral pH from MD simulations at 100 and 225°C. The early steps in unfolding to the transition state and the disruption of helix packing are illustrated at 100°C. The unfolding at 100°C is on the proper time scale, as estimated from experiment. However, as the process is accelerated by temperature, the conformational heterogeneity of the denatured state is better sampled at 225°C. The crystal structure (17) is given as the 0-ns conformation. All structures are colored according to the placement of native helical structure: helix I, residues 10–22, in red; helix II, residues 28–38, in green; and helix III, residues 42–55, in blue. Helical structure, as determined using the method of Kabsch and Sander (43), is illustrated by ribbons. Trp-48, the fluorescence probe, is shown in magenta. This residue becomes exposed to solvent at the transition state and remains exposed thereafter at both temperatures. Note the similarity between the transition states at different temperatures: the displayed transition state structures have an α-carbon rms deviation of 3.8 Å, which is lower than their rms deviations from the starting structure (3.9 and 5.3 Å for 100 and 225°C, respectively).

