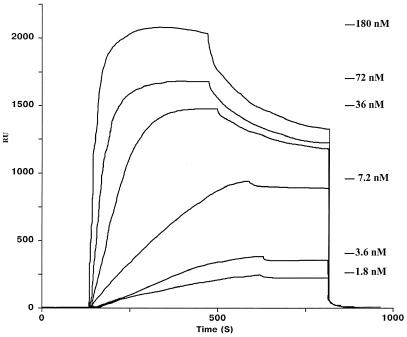
Figure 1.
BIAcore analysis of affinity binding between idiotype AE2 and antiidiotype 9A8. Binding of different concentrations of 9A8 to immobilized AE-2 is presented on the sensorgrams. The binding constant was calculated from the experimental curve by nonlinear regression analysis (kon/koff = 2.26 109 M−1).

