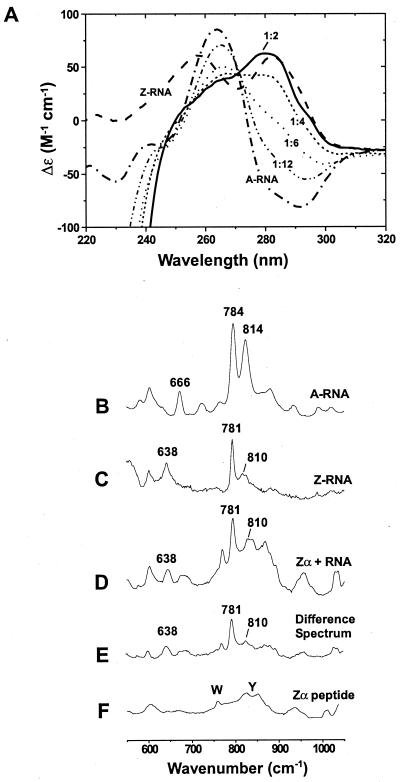
Figure 1.
The Z-RNA conformation can be stabilized by Zα, as shown by CD and Raman spectroscopy. CD studies: (A) Spectra are shown for 5 μM duplex r(CG)6 in the A-form (–⋅–⋅–). All samples contained 10 mM Na2HPO4 (pH 7), 20 mM NaCl, and 0.5 mM EDTA. In 6.5 M NaClO4, the typical Z-RNA spectrum is seen (– – –). The A-RNA spectrum changes as Zα is added (Zα has no CD signal above 250 nm, but a strong negative ellipticity below 250 nm). Spectra are shown for the addition of 5 μM Zα (-⋅⋅-⋅⋅-), which is 1 Zα:12 bp; 10 μM Zα (⋅ ⋅ ⋅ ⋅), 1:6; 15 μM Zα (- - - -), 1:4; and 30 μM Zα (——), 1:2. Inversion of the CD bands around 285 nm and the decrease in signal at 266 nm are characteristic of the A → Z transition. Raman spectroscopy: (B) The A-form of r(CG)6 (5 mM duplex) has doublet peaks at 784 and 814 cm−1, which are characteristic of the A-conformation. (C) Z-conformation of r(CG)6 (5 mM duplex) induced by 6.5 M NaBr. The bands at 781 and 638 cm−1 and markedly reduced intensity at 810 cm−1 distinguish the Z-RNA conformation from the A-form (B). (D) Zα⋅r(CG)6 complex containing 15 mM Zα and 5 mM r(CG)6 duplex (1 Zα:4 bp RNA). This spectrum has several features identical to those of the salt-induced Z-RNA spectrum (C), notably intensities at 638, 781, and 810 cm−1. (E) Difference spectrum created by digitally subtracting the Zα spectrum (F) from that of the Zα⋅RNA complex (D). (F) Zα peptide spectrum (15 mM Zα). Raman bands for the aromatic amino acids tryptophan and tyrosine are labeled.

