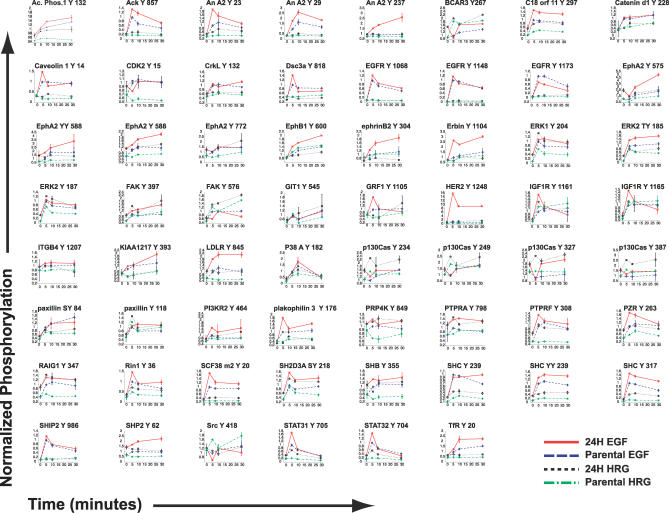
Figure 1. A Mass Spectrometry Approach Measured 248 Phosphorylation Profiles.
The title at the top of each entry indicates the phosphosite measured. Median normalized phosphorylation (see Methods) is plotted at 0, 5, 10, and 30 min. For each phospho-site, four conditions were measured: parental + HRG (80 ng/ml), 24H + HRG (80 ng/ml), parental + EGF (100 ng /ml), and 24H + EGF (100 ng/ml). Error bars indicate ± standard deviation. The data were obtained from [10].

