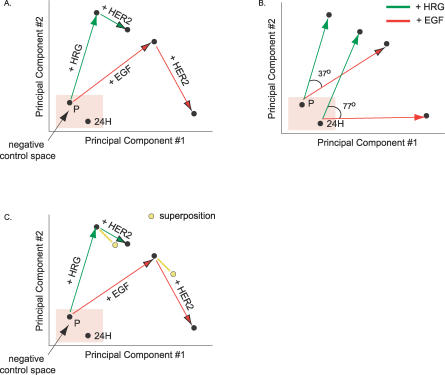
Figure 3. PLSR-Generated Scores Plot Reveals Different Signaling Strategies for EGF and HRG.
(A) A scores plot identifies separation in signaling strategies associated with receptor overexpression or differential ligand treatment along two signaling axes.
(B) HRG and EGF treatment give rise to different sets of signals, and the difference is exaggerated in 24H cells.
(C) The linear superposition of the difference vector between 24H and parental serum-free conditions and each ligand's vector explains 24H + HRG signaling but not 24H + EGF signaling.

