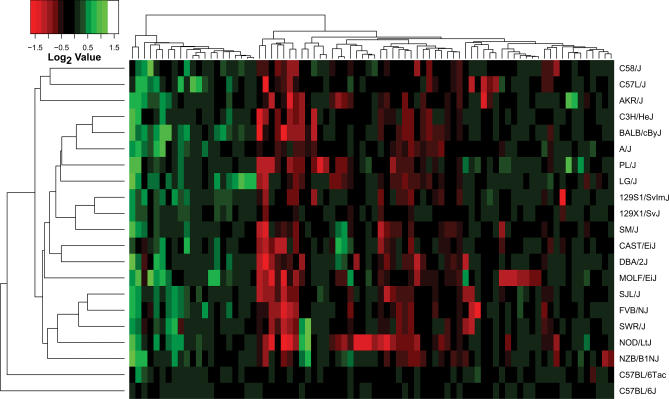
Figure 5. Heatmap Representation of Copy Number Changes in Mice.
Unsupervised clustering of segmental gains (green) and losses (red) yields a dendrogram that recapitulates features of the known genealogy of these strains. Clustering in the vertical axis demonstrates three clusters: segments amplified in most strains, segments reduced in most strains, and a third cluster containing either singleton CNVs or mixtures of amplifications and deletions.

