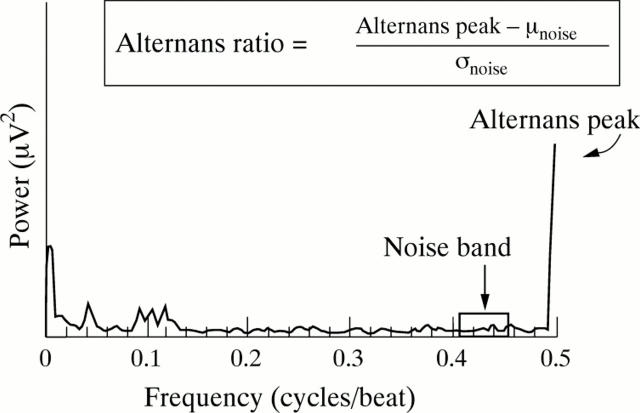
Figure 1 .
Representative example of power spectrum of beat to beat fluctuations in T wave morphology. The alternans ratio is the amplitude of the spectrum at the alternans frequency (alternans peak) minus the mean background noise level (noise), divided by the standard deviation of the noise (noise) in the reference noise band.

