
Fig. 3.
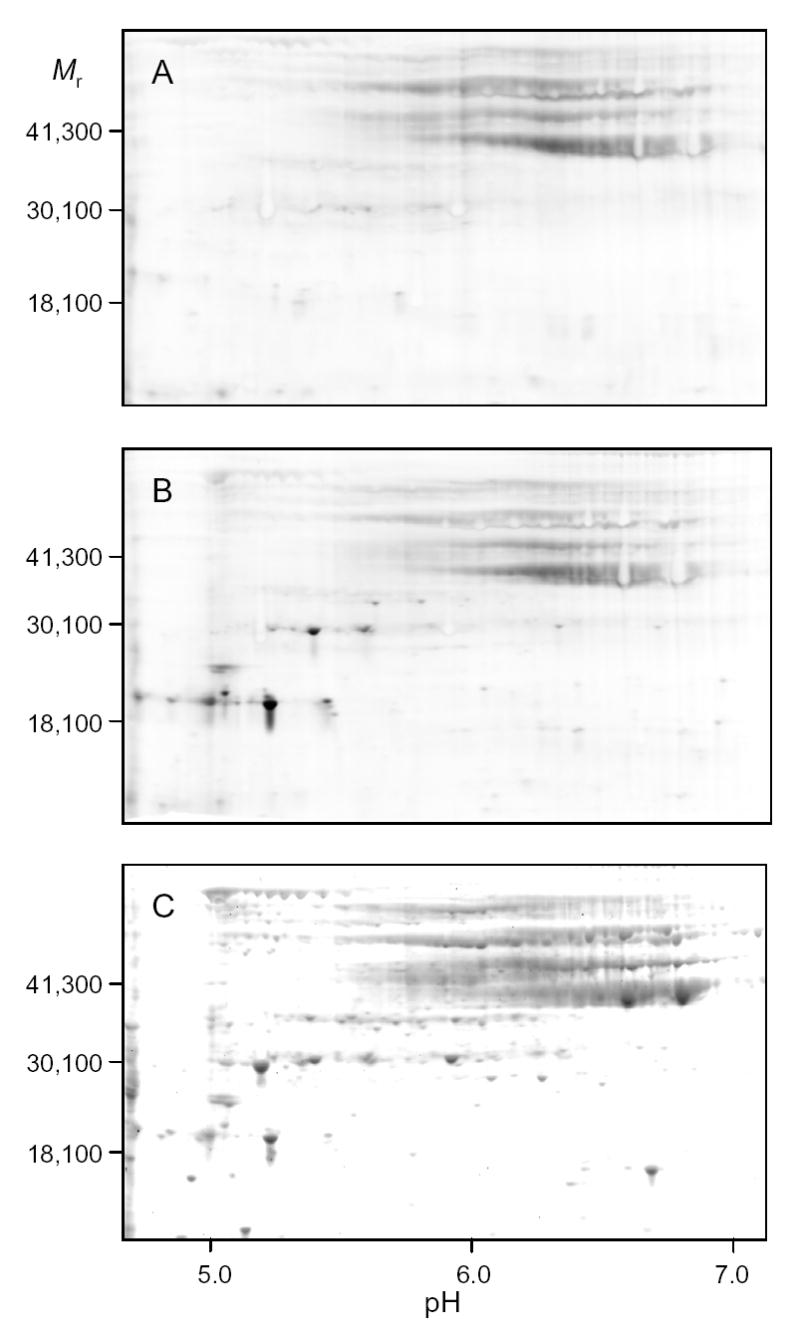
Comparison of disulfide bond labeling in cellular proteins using two-dimensional electrophoresis. Cellular protein samples from the parental strain following a shift to acetate medium in the presence of hydrogen peroxide were taken as indicated in Fig. 2. Samples were electrophoresed using isoelectric focusing in the pH 5–8 range. Fluorographs of gels are shown in panels A (− DTT) and B (+ DTT). Total proteins in Gel B were subsequently stained with SYPRO Ruby (C).