
Fig. 4.
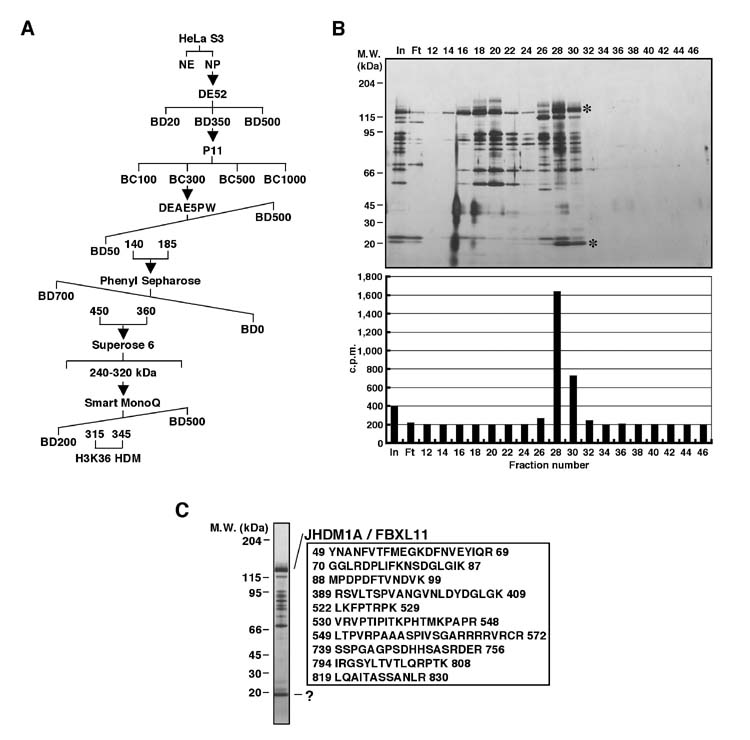
Purification of a H3K36-specific histone demethylase JHDM1A. (A) Schematic representation of the steps used in purifying the demethylase activity. Numbers represent the salt concentrations (mM) at which the histone demethylase activity elutes from the column. (B) A silver stained protein gel (top panel) and histone demethylase activities (bottom panel) of the protein fractions derived from a 0.1 ml MonoQ column. The candidate proteins that co-fractionated with the demethylase activity are indicated by *. The positions of the protein size markers on SDS-PAGE are indicated to the left of the panel. (C) A silver stained protein gel containing the samples for protein identification. The candidate protein band was identified by mass spectrometry. A total of 34 peptides covering 30% of JHDM1A/FBXL11 (NP_036440) from the top protein band were identified. Selected peptides identified from mass spectrometry are listed. The numbers correspond to the amino acid numbers in the JHDM1A protein. The “?” represents an unidentified JHDM1A associated protein.