
Figure 1.
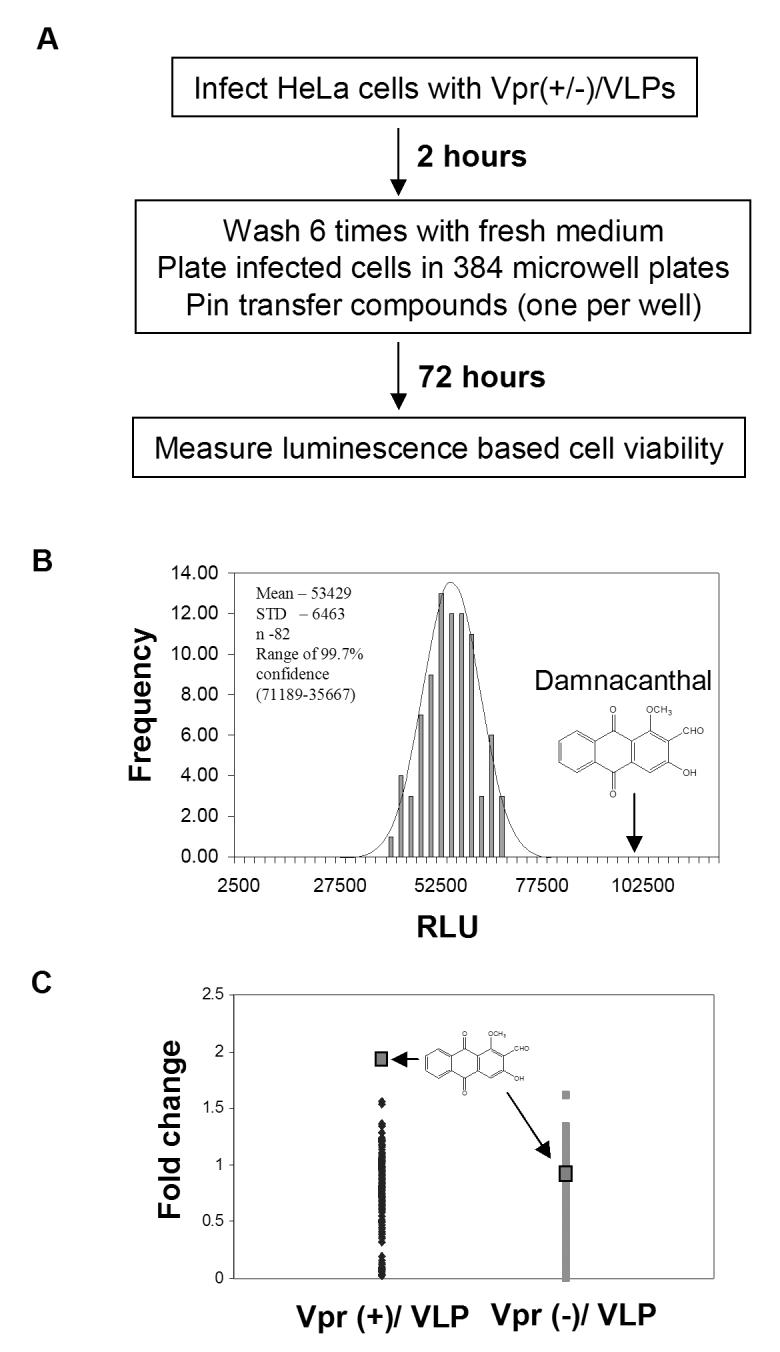
A small molecule screen for inhibitors of Vpr dependent cytotoxicity.A) A schematic diagram of a screen for small molecule modulators of Vpr induced cell growth cessation. B) The frequency distribution of luminescent activities of untreated Vpr+/VLP infected HeLa cells. The arrow indicates the luminescent value of Dam treated cells. Mean, standard deviations (STD) and range of 3 STDs of untreated samples are shown. C) Fold change in cell viability via Dam in Vpr+/VLP or Vpr-/VLP infected cells compared to other compounds. Fold change was calculated as compound treatment value/mean untreated value.