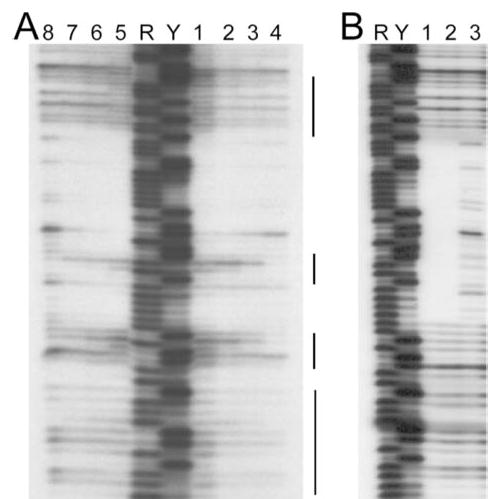
FIGURE 3. DNase I footprinting analysis of Abh and AbrB binding to the BS18 target.

Shown are the results using 124-bp EcoRI-HindIII fragments containing the BS18 target sequence (34) labeled at the EcoRI end. A, Abh binding reactions performed at pH 7 (lanes 1– 4) versus pH 8 (lanes 5– 8). Lanes 1 and 5, 30 μM Abh; lanes 2 and 6, 10 μM Abh; lanes 3 and 7, 3 μM Abh; lanes 4 and 8, no Abh. B, AbrB binding reactions performed at pH 8. Lane 1, 10 μM AbrB; lane 2, 2 μM AbrB; lane 3, no AbrB. Maxam-Gilbert purine (R) and pyrimidine (Y) sequencing ladders are shown for reference. The vertical lines marked indicate regions showing significant enhancement of DNase I cleavage due to the presence of bound Abh.
