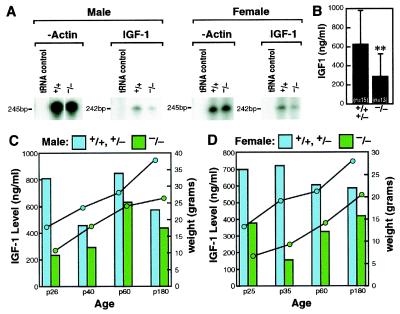
Figure 3.
Decrease of IGF-1 gene expression and serum levels in p/CIP(−/−) mice. (A) RNase protection analysis on liver mRNAs by using specific probes; loading of RNA were normalized based on beta-actin levels. From 100–200% decreases of IGF-1 transcript were observed in age- and sex-matched, p25 mice. (B) IGF-1 serum levels in wild-type, heterozygous, and p/CIP(−/−) mice. **, P < 0.01. (C and D) Growth rates and serum IGF-1 levels in wild-type, heterozygous, and p/CIP(−/−) mice.

