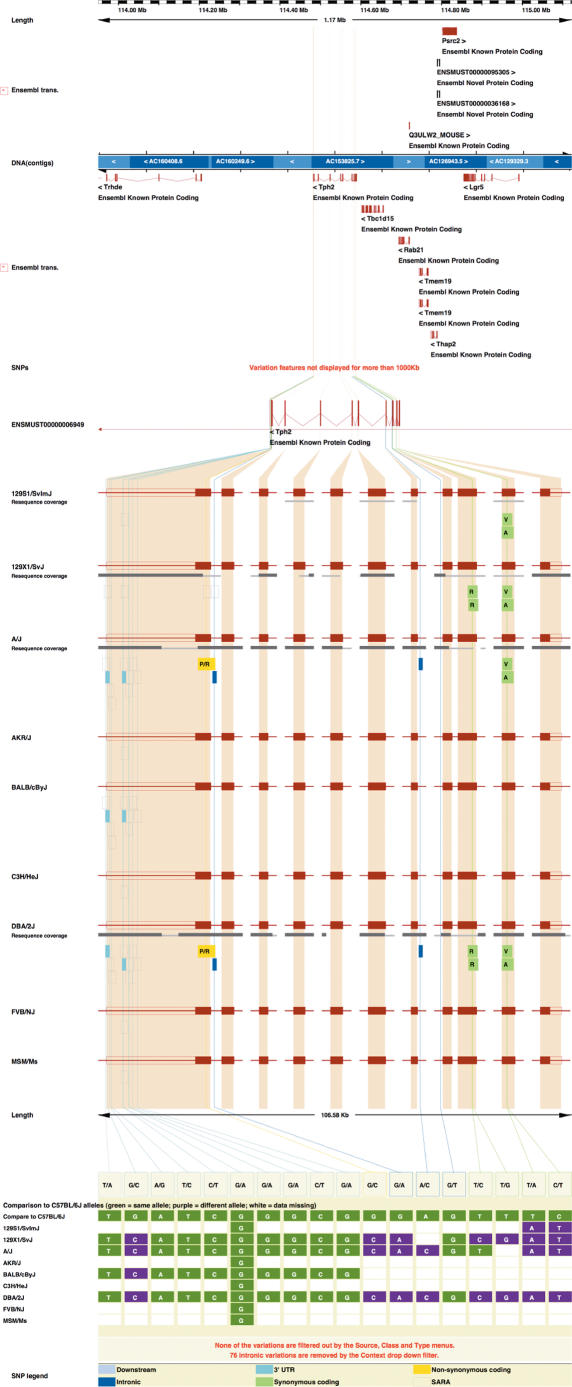
Figure 3.
Figure shows the sequence variation across mouse strains for the transcript ENSMUST00000006949 in the new view TranscriptSNPView. Strain-specific SNPs were calculated by aligning mouse reads from different strains against the reference genome as described previously (25). This gene-centric view collapses the size of introns to focus on variation within exons, which are shown separately for each strain with the consequences of any SNPs on their coding sequence. The extent of resequencing coverage is also shown for each strain.

