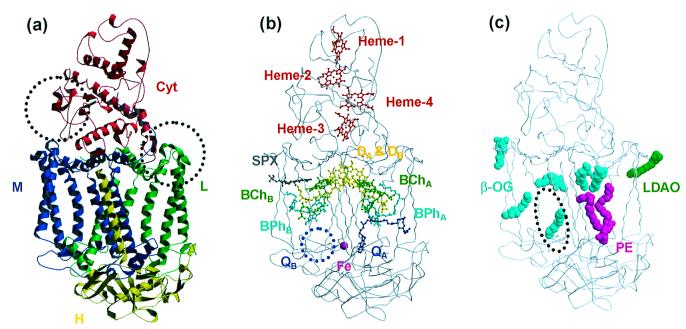
Figure 1.
Overall structures of the RC from Tch. tepidum. (a) The ribbon models represent four polypeptide chains: Cyt (red), L (green), M (blue), and H (yellow). The dotted circles indicate two regions where the loop conformations are different from those of the Blc. viridis RC (Left: Gln-C161–Asn-C162; Right: Gly-L56–Leu-L64). (b) The ball-and-stick models represent the configuration of the prosthetic groups (DA and DB: special-pair; BChA and BChB: bacteriochlorophyll a monomers; BPhA and BPhB: bacteriopheophytin a molecules; QA: menaquinone-8; Fe: nonheme iron; Spx: spirilloxanthin; Heme-1, -2, -3, and -4: heme c groups). The secondary quinone (QB) site (blue dotted circle) is empty because QB was not observed in the electron density maps. (c) The space-filling models represent the detergent and lipid molecules observed on the molecular surface. Six β-OG molecules are represented by cyan. One LDAO molecule and one lipid molecule (P) are represented by green and magenta, respectively. The dotted circle indicates the binding site of the cardiolipin in the Rb. sphaeroides RC structure (49).

