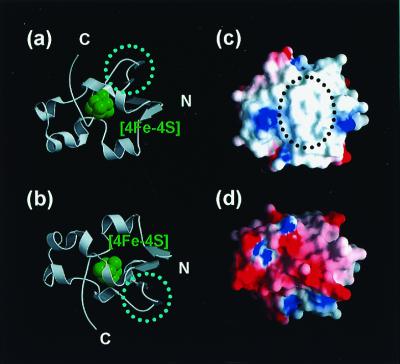
Figure 3.
Overall structure (a and b) and charge distribution of the molecular surface (c and d) of the HiPIP from Tch. tepidum. The molecule is viewed from the side proximal to the [4Fe-4S] cluster (a and c) and from the side distal to the [4Fe-4S] cluster (b and d). (a and b) Ribbon model with the [4Fe-4S] cluster shown in green. The dotted circles indicate the two strands of β-sheet whose conformation is different from that of the Ach. vinosum HiPIP. (c and d) Molecular surface with the charge distribution (negative charge: red; positive charge: blue). The molecular surface proximal to the [4Fe-4S] cluster forms a large hydrophobic patch, as shown in the dotted circle, whereas that of the distal side is hydrophilic and mostly negative.

