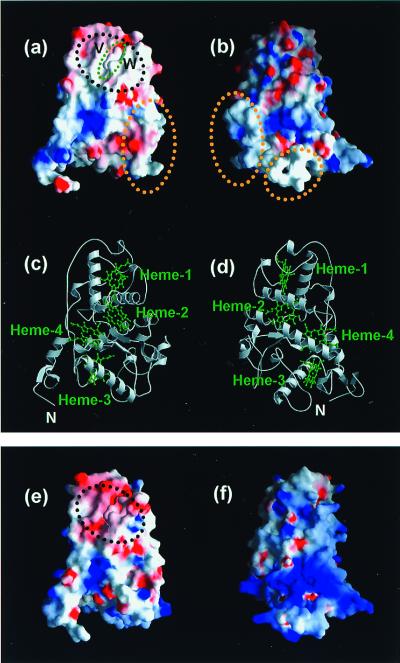
Figure 4.
Structures of the Cyt subunits of Tch. tepidum RC (a–d) and Blc. viridis RC (e and f). (a and b) Charge distribution of the Cyt subunit of Tch. tepidum around the heme-1 (a) and viewed from the backside of the heme-1 (b). The negatively charged surfaces are shown in red, and the positively charged surfaces in blue. The molecular surface around the heme-1 is mostly hydrophobic, which is shown in the black dotted circle. The protruding part of the heme-1 is shown in the green dotted circle. V and W indicate the Val-C65 and Trp-C94, respectively, which affect the molecular recognition of the RC and HiPIP. The yellow dotted circles indicate the two loop regions whose conformations are different from those of the Blc. viridis RC. (c and d) Ribbon model of the Cyt subunit of Tch. tepidum viewed from the same angle as that for a and b, respectively. Each heme is shown in green. (e and f) Charge distribution of the Cyt subunit of Blc. viridis viewed from the same angle as that for a and b, respectively. The molecular surface is generated by using the atomic coordinates of the RC from Blc. viridis (PDB code: 1PRC). In Blc. viridis, only the molecular surface around the heme-1 is acidic, which is shown in the black dotted circle, and most of the other surfaces are basic.

