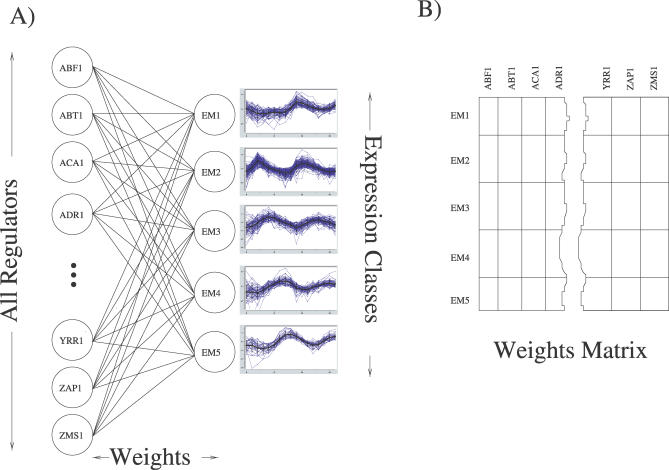
Figure 1. The Artificial Neural Network Architecture.
(A) Shown is the simple single layer network we trained to predict expression behavior based on the in vivo binding activity of ∼75% of the transcription regulators in yeast. A 204-dimension vector containing the measured transcription factor binding data from [21] was used as the input vector. Given this binding vector, the ANN was trained to predict which of the five cell cycle expression classes (clusters) each gene belongs to. These expression classes were determined using EM MoDG.
(B) Matrix representation of the ANN. Each matrix cell, Wc,r, represents the real-valued connection strength, or weight, between a regulator (r) and an expression class (c) and is shown in (A) as an edge between a regulator and an expression class. These weights represent the importance of binding activity or inactivity for each transcription factor in associating a member gene with its expression class (cluster) under the ANN model.

