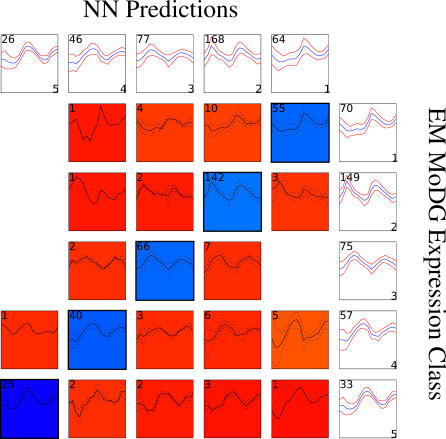
Figure 2. Confusion Array Display for the aobANN versus Membership in EM MoDG Expression Class.
Expression class predictions from the aobANN (based on ChIPchip factor binding data) are displayed in a confusion array against the starting expression classes from EMDoG clustering. Each of the 40 contributing “best” ANNs were trained on 80% of the data and tested on the remaining 20% to evaluate performance. They were selected as the best performing network out ten networks trained on the same data split, but initialized with differing random seeds. These two classifications have a similarity of .86 by linear assignment [9]: an LA value of 1.0 would indicate perfect classification success by the ANNs.

