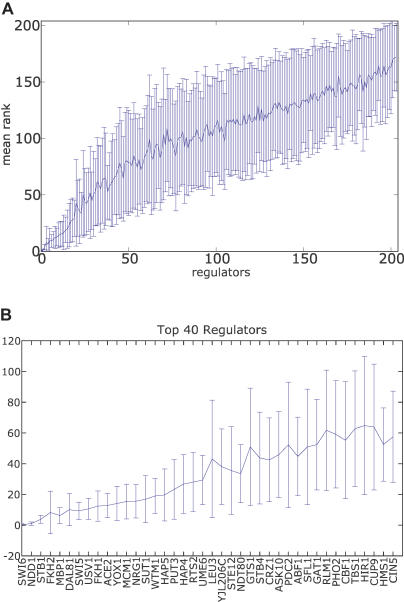
Figure 5. Neural Network Rank Order Stability.
(A) Regulators are sorted by their SOS rank order (see text and Methods). The line indicates the mean rank for each regulator across each of 40 best ANNs, with variance of each ranking indicated by the error bar.
(B) Top 20 regulators show high stability across ANNs.

